
1811-5209/24/0020-0187$2.50 DOI: 10.2138/gselements.20.3.187
Keywords: cratons; cratonic lithosphere; geodynamics; seismology
INTRODUCTION
Encapsulating several billion years of Earth’s history, the cratonic lithosphere holds considerable potential and promise for understanding the evolution of the Earth’s interior. The term lithosphere refers to the outermost region of the Earth that includes the crust plus some portion of the upper mantle which, together, comprise a “zone of strength” that typically behaves as a coherent unit. Much as the crust’s rock record captures different geologic events, so does the deeper subcrustal portion of the lithosphere. Our goal in this chapter is to encourage the community to dig deeper into the complexity inside the oldest and typically most stable regions of the deep lithosphere—the cratonic lithosphere.
Tapping into the geologic history recorded in the deep cratonic lithosphere requires first unraveling a complex rock record only accessible by indirect methods that tend to smooth out and/or under-sample the cratonic lithosphere. Adding to that challenge is that the two primary methods of observation—geochemical and isotopic analysis of xenoliths and geophysical imaging—record different time periods with xenoliths capturing deep time (including events from their formation onward) and geophysical imaging documenting the present day, literally providing a snapshot of “now.” We often rely on geodynamic modeling to fill in the gaps in space and time between these two approaches, although care must be taken in interpreting those models due to the uncertainties inherent to simulating complex and poorly constrained systems. Even if relying on static images of the current structure, incomplete sampling of rocks and minerals, and non-unique geodynamic models, much has been learned about cratons by peering into their deep structure. We know that cratonic lithosphere is old (Archean to Proterozoic), thick (200–300 km), cold (surface heat flux values of 30–40 mW/m2) (all ranges from Lee et al. 2011 and references therein), and mostly resistant to deformation (e.g., Bedle et al. 2021 and references therein).
At first pass, cratonic lithosphere may seem passive and tectonically “boring” as it remains seemingly unscathed despite long and complex tectonic histories. That tectonic boringness provides a geologic puzzle—is the long-lived nature of cratonic lithosphere due to its inherent properties, changing mantle dynamics, or some combination of the two? For example, past stresses driven by mantle convection may have been lower in such a way that allowed for long-term survival of cratonic lithosphere, in addition to its inherent properties that promoted stability (Bedle et al. 2021). Alternatively, there could have been mechanisms that allowed for both the destruction and regrowth of cratonic lithosphere (Kusky et al. 2007; Peng et al. 2022) in a manner that mimics longevity in a changing dynamic interior. Both viewpoints, whether non-participatory and long-lived or actively reworking, demonstrate the potential to better understand the geologic history trapped within the deep cratonic lithosphere. The modern-day presence of cratons hence not only allows for the evaluation and constraining of past dynamics, but also for the investigation of the limits of lithospheric strength. Much of the research on the cratonic lithosphere has focused on its thickest portion, referred to as the root, or the core, with less emphasis on its margins. This root-centered focus is because the root itself is likely the key to stabilizing cratons. Yet, it could also be because defining the lateral extent of cratons and cratonic lithosphere is challenging. Indeed, ask a room full of geologists, geochemists, seismologists, and geodynamicists to point out on a map the western edge of the North American craton and you will get wildly different answers depending on whether the edge should be defined by age, lithospheric thickness, lack of recent deformation, composition, some combination of the above, or yet other reasonings. It is important to point out that the inconsistency in answers does not mean that one group is “right” and another is “wrong.” Rather, it is just a reminder of the messiness and heterogeneity that the dynamic, complex Earth brings about. The challenge in pinning down the lateral boundaries of cratons at the surface is not just a semantic argument of the best way to define a craton and cratonic lithosphere, it is also our ability to observe, interpret, and contextualize the variations within cratonic lithosphere.
At depth, cratonic lithosphere is as geologically complex as the surface exposures of cratons. Cratonic lithosphere is not homogenous nor uniform in composition, shape, rheology, or thickness, certainly not across regions (although there may be commonalities) and likely not within a single region either. Cratonic lithospheric structure reflects its formation and any subsequent events. As such, there may be portions within cratonic lithosphere with slightly or largely differing properties, each marking a different episode in that craton’s history. If containing zones of weakness, these heterogeneities could change the trajectory of the cratonic lithosphere evolution by leading to regional or large-scale deformation; however, if the regions are only slightly modified, then they may just be an artifact of the past with limited impact on craton stability.
The margins themselves represent variations in the cratonic lithosphere as they are the lateral transitions between cratonic and surrounding lithosphere. These transitions could be an abrupt change in thickness, composition, rheology, or age; they could mark a more gradual deepening without a change in composition; or any combination of the above. Regardless, the margins of cratons are a great testament to why understanding heterogeneity in cratonic lithospheric structure is important. The margins of cratonic lithosphere serve as the first line of defense for cratons. When cratons do deform, the deformation often initiates at the margins (e.g., Currie and van Wijk 2016; Chin et al. 2021; Cooper et al. 2021). If the margins are sufficiently weaker than the cratonic core, then they may buffer the interior from deformation and destruction (Lenardic et al. 2000). Interestingly, a cratonic margin’s propensity to deformation also leads to that area being the most likely to be reworked, reshaped, and, potentially, no longer as easily identifiable as “cratonic lithosphere.”
Cratonic lithospheric margins are just one example of the complexity within the cratonic lithospheric structure. There are also zones of pre-existing weaknesses, sutures, vertical variations, phase transitions, and much more packed into these tectonically “boring” regions of the Earth’s interior waiting to be carefully unraveled and have their stories told. In this chapter, we hope to lay the foundation for these stories by reviewing our current knowledge of the general cratonic lithospheric structure, expand on that framework with a discussion of some of the additional complexity mentioned above, and propose approaches to address that complexity in future work. While we may not be able to resolve the argument over any given map, we do hope that we can shift it to a deeper conversation about the why behind the differing answers.
GENERAL CRATONIC LITHOSPHERIC STRUCTURE
The basic vertical structure of the cratonic lithosphere can be described as a set of embedded boundary layers (Fig. 1). The term boundary layer comes from fluid mechanics and is used to define the region in a fluid near a surface wherein the fluid motion is affected by that surface; specifically, the boundary layer is the layer of fluid that encompasses the velocity gradient between the ambient fluid motion and the velocity of the fluid at the surface, assuming that the fluid and the surface are coupled (“no-slip” condition). In other words, it marks the transition between a background state (ambient fluid motion) and an abrupt change (surface). The concept of a boundary layer has been adopted and expanded by the Earth science community to describe transitional regions due to large variations in various parameters near primary boundaries (typically the surface of the Earth and the core–mantle boundary). For example, the lowermost region of the atmosphere that is affected by the Earth’s surface is described as a boundary layer. Likewise, within the interior of the planet, the transition between the surface of the Earth and the convecting mantle encapsulates large changes in many quantities including temperature, composition, rheology, and seismic velocity. The depth at which each quantity reaches average values associated with the ambient convecting mantle varies. In other words, defining the lithosphere, beyond a “zone of strength,” as a single entity with a clear base connected to a single value is intractable. Indeed, this challenge may be an explanation for why terms such as mechanical lithosphere, seismic lid, thermal boundary layer, etc. are all used to represent the Earth’s lithosphere with each term providing varying estimates of lithospheric thickness. Each term describes a region that encompasses a single, specific transition, which may not and need not be occurring at the same range of depths as another term. Instead of adhering to a single perspective, we therefore encourage the community to conceptualize the lithosphere as a collection of transitions, or nested boundary layers (Fig. 1), which is what we refer to when using “lithosphere” in a general sense within this chapter. In addition, when we provide estimates for values of lithospheric thickness, we delineate to which transition depth those thicknesses refer.
Early ideas on the cratonic lithosphere were framed on the premise of competing effects of a chemical versus thermal boundary layer in recognition of the observed lack of gravity anomalies over cratonic regions (Jordan 1978). Observations of surface heat flux and other indicators of thermal structure, such as temperature and pressure estimates from cratonic xenoliths, indicate that the cratonic lithosphere is at a cooler state than the surrounding mantle (Lee et al. 2011 and references therein). This cooler state would place the cratonic lithosphere in a state of negative thermal buoyancy with a net downward force (as well as increasing its temperature-dependent viscosity). Yet, this expected density excess, due to being in a cooler state, is not generally observed within gravity surveys over cratonic regions (Jordan 1978), meaning that the effect of thermal contraction is somehow compensated. In other words, the concept of solely a thermal boundary layer is inadequate to describe the cratonic lithosphere, as it tends to overestimate the density structure. Jordan (1978) reconciled this discrepancy with the isopycnicity hypothesis, which proposed that the negative thermal buoyancy resulting from a cooler thermal structure is exactly offset by a positive chemical buoyancy driven by a compositionally less dense cratonic lithosphere, compared with the surrounding upper mantle; the net result being that the craton is in a state of neutral buoyancy. Indeed, cratonic mantle lithosphere does have lower density than average mantle peridotite (e.g., Lee et al. 2011). Although providing an argument for the isopycnic hypothesis (Jordan 1978), the unique composition of cratonic mantle lithosphere may not provide for perfect isopycnicity wherein the negative thermal buoyancy is exactly offset by the positive chemical buoyancy of the cratonic lithosphere at every depth. Such a state would require a stratified compositional structure of increasing cratonic lithosphere density with depth that is not often observed in cratons (Lee et al. 2011). Instead, the integrated density structure of cratonic lithosphere on average may provide sufficient positive buoyancy to keep the craton neutrally buoyant (Lee et al. 2011), although there are some arguments that cratonic lithosphere is negatively buoyant due to a denser composition (Wang et al. 2022), cooler state, or a combination of both (Mooney and Vidale 2003).
The distinct chemical compositions observed within cratonic xenoliths introduce an additional descriptor for the cratonic mantle lithosphere—a chemical boundary layer that encompasses the transition between mantle lithosphere with a unique composition (cratonic lithosphere) and the average composition of the upper mantle. The premise of a chemical boundary layer provides then an opportunity to conceptualize the processes that would produce a thick, compositionally distinctive lithosphere. Analyses of cratonic mantle xenoliths suggest that high degrees of melt extraction, likely due to hotter past mantle temperatures, are required to explain their geochemical signatures (Boyd 1989). This requirement has launched various interpretations of the tectonic settings (mid-ocean ridge, continental arc, plumes) that have provided the origins for cratonic mantle lithosphere (Lee et al. 2011). Regardless of the origin, the high degree of melt depletion also suggests a degree of devolatilization that would promote dry, viscous lithosphere (Lee et al. 2011 and references therein). As such, the chemical boundary layer may also act as a rheological boundary layer providing enhanced viscosity (beyond that provided by cooler temperatures) and buoyancy, both of which in turn promote resistance to deformation and longevity of the cratonic lithosphere.
If the chemical boundary layer represents the portion of the cratonic lithosphere that is rigid and resistant to deformation, then the chemical and thermal boundary layers are inherently linked. Heat transfer within the chemical boundary layer is limited to conduction if, indeed, it is resistant to deformation. The thermal boundary layer is the region that encompasses the temperature change between a surface and a convecting fluid, in this case, between the temperature at the surface of the Earth and that of the average convecting mantle. It can also be envisioned as the transition between two heat transfer modes—conduction and convection. As such, if rigid, then the presence and thickness of the chemical boundary layer control the portion of the thermal boundary layer wherein conduction is the primary heat transfer mode (Cooper et al. 2004). The thermal boundary layer extends past the chemical boundary layer. The region between the base of the chemical boundary layer and the base of the thermal boundary layer (often called the convective sublayer) is susceptible to small-scale deformation, convection, and dripping. The material within the convective sublayer could have the same composition and rheology (Cooper et al. 2004), or slightly different (e.g., Evans et al. 2011), as the average surrounding mantle, but at cooler temperatures and, thus, higher viscosities. This convective sublayer, which can deform, may then act as a protective barrier for the chemical boundary layer and cratonic lithosphere.
The thick, thermal boundary layer associated with cratonic lithosphere is inferred in part from low heat flow (e.g., Lee et al. 2011) within the cratons and in part, and more widely, from high seismic velocities. Global tomography models, such as Schaeffer and Lebedev (2013), depict high velocities that extend down to ~250 km within the mantle beneath cratons, helping to define the depth of the cratonic lithosphere, in this case, typically the depth of the base of the thermal boundary layer. Some cratonic mantle xenoliths sample the chemical boundary layer and, as such, estimates of cratonic lithospheric thickness based on these xenoliths provide the depth of its base. In addition to temperature, seismic waves are also sensitive to composition, providing additional insight into the nature of the chemical boundary layer, as well as outlining the extent of the thermal boundary layer. For example, in addition to the cooler temperatures, the observed high seismic velocities within cratonic lithosphere have been interpreted to also be due to the highly melt-depleted compositions measured in some cratonic mantle xenoliths (e.g., Jordan 1978; Lee et al. 2011). However, studies of melt extraction effects on seismic velocities have now shown that this compositional distinction results in only subtle changes (e.g., Afonso and Schutt 2012). Consequently, high cratonic velocities may be due to compositional factors driven by processes other than melt extraction (e.g., Dalton et al. 2017).
In addition to the above, there are several other ways to define and describe the cratonic lithosphere, including the electrical lithosphere, which describes observed changes within the electrical conductivity (Evans et al. 2011); for a more in-depth review, see Fischer et al. (2020). Each of the nested transitions that collectively comprise the cratonic lithosphere may contribute to, or elucidate, the controls on craton stability and longevity. For example, the cooler temperatures within the thermal boundary layer contribute higher viscosity values within the cratonic lithosphere (presuming a temperature-dependent rheology). Regions of lower conductivity may indicate less water or melt content (Evans et al. 2011), both of which would also promote higher viscosity values. As mentioned, both the lower density and higher viscosity associated with a chemical boundary layer produced through high degrees of melt extraction also promote craton stability.
In other words, understanding the structure of cratonic lithosphere means understanding first the condition of cratons— mostly undeformed, long-lived regions—from which any subsequent deformation must be explained. Our short summary above demonstrates tremendous potential for complexity within the general vertical structure of cratonic lithosphere. It is from this conceptual grounding that we now turn our attention to what might be gleaned from lateral variations within cratonic lithosphere.
LATERAL VARIATIONS
As mentioned, cratonic lithospheric structure is a result of the cumulative events that the craton experienced during its lifetime. As such, conceptually, one would expect lateral variations at depth within the cratonic lithosphere. Even if a craton remained perfectly undeformed during its history, it is unlikely that it would be laterally homogeneous unless the cratonic lithosphere was formed in a single event (which also seems unlikely, see Lee et al. 2011). During formation, lateral variations in thickness, composition, and/or rheology may be introduced if cratonic lithosphere is thickened through accretion or compression (Cooper and Miller 2014; Pearson et al. 2021). Post-formation, cratonic lithosphere may experience re-fertilization, re-heating, metasomatism, shearing, thinning, and/or slow re-hydration (e.g., Lee et al. 2011). Interpreting the causes of lateral variations within cratonic lithosphere, whether formation or post-formation processes, requires better constraints on the potential longevity of complex lithospheric structures.
The upper crust, and even whole crustal structure, of the continents have been imaged with active source (explosions or other man-made sources) experiments and earthquake-based methods targeting the crust–mantle boundary depth, whereas the lithospheric-scale structure of the deep cratons remains less well known. As the density of seismometers increases with the expansion of temporary passive deployments, geophysicists are increasingly able to sharpen the images of the complexity of the cratonic lithosphere’s internal structure. Fischer et al. (2020) and references therein synthesize the community’s advancements in imaging the continental lithosphere by documenting how we are learning more about the continental interiors. Recent efforts utilizing different, complementary seismic techniques and datasets, such as various types of tomographic imaging, inferring seismic anisotropy, and analyses of converted and reflected waves, has changed our initial conception that cratons were primarily neutrally buoyant, cold, and seismically fast monoliths. Part of that increased knowledge includes the advent of the discovery and increased recognition of mid-lithospheric discontinuities (MLDs), which may provide important clues about the internal structure of cratonic lithosphere (for a more in-depth review of the potential origins of MLDs, see Fischer et al. 2020).
Lateral complexity is also recognized from mantle xenolith observations. For example, although overall mostly dry, the water content within cratonic peridotites varies both vertically and laterally (Peslier et al. 2017), as does olivine composition (O’Reilly and Griffin 2006). Intriguingly, the textures of xenoliths also change across the cratonic lithosphere with some textures capturing past localized deformation events, such as lithospheric drips (Chin et al. 2021). Much like seismic observations, cratonic xenoliths point to lateral and vertical complexity within cratonic lithosphere as the norm rather than the exception.
There are dynamic consequences to lateral variations. Changes in cratonic lithospheric thickness, or the shape of deep cratonic margins, can affect cratonic stability by channelizing mantle flow against the interior of the craton (Cooper et al. 2021). Thicker cratonic lithosphere can deflect mantle plumes to thinner regions (Sleep et al. 2002). The sharp lateral change in temperature between thick cratonic lithosphere and the surrounding mantle can induce small-scale convective instabilities, called edge-driven convection, that can drive anomalous thermal upwellings and melting events (King and Anderson 1998). Areas of pre-existing weakness within the cratonic lithosphere may catalyze deformation and eventual craton destruction (Liu et al. 2018). Conversely, cratonic lithosphere also has the potential to preserve weak regions within their domain (e.g., Liu et al. 2018; Fu et al. 2022).
Some of these consequences are visualized in the simulations in Figure 2, which demonstrate the potential impact of heterogeneity within the cratonic lithosphere. All simulations were run using Underworld2 (Mansour et al. 2020; https:// doi.org/10.5281/zenodo.1436039) and full details can be found at this online repository (https://github.com/coopergeodynamics/ elementspaper). The first column in Figure 2 represents the simplest scenario in which a cratonic lithosphere consisting of a chemical boundary layer (the green region) with a uniform enhanced viscosity and sloped margins on each side is emplaced into the upper thermal boundary layer of the convecting mantle (in grayscale, the upper thermal boundary layer (TBL) is the darkest gray region extending from the surface). In this simulation, as with the rest, the behavior of the cratonic lithosphere happens in response to the dynamics of the convecting mantle. In other words, no lateral compression, extension, or plate forces were imposed. During this simulation, the cratonic lithosphere translates across the surface in response to the mantle dynamics with no discernible deformation. Even for this simple case, we see the development of edge-driven convection within the convective sublayer (CSL) along the right margin of the cratonic lithosphere. As we add progressive complexity to the cratonic lithosphere in the set of simulations by introducing slightly weaker margins (orange regions along the edges of the chemical boundary layer (CBL) in Fig. 2) and/or pre-existing weak zones (yellow regions in the interior of the righthand side of the CBL in Fig. 2), the behavior changes with the deformation occurring either within the margins or the pre-existing weak zone. In the most extreme case (fourth column), wherein the pre-existing weak zone was prescribed the same rheology as the convecting mantle, the entire cratonic lithosphere split apart along the weak zone (whose material was then reworked into the convecting mantle) and then came back together (with the plate motions likely driven by competing effects of mantle plumes and subduction-like downwellings). By comparison, within the simulation with a pre-existing weak zone (third column), the weakened region (in yellow) experienced some localized thinning, but overall, the entire cratonic lithosphere remained intact. Note that to keep from changing too many parameters at once and allow for ease of comparison among simulations, we only considered rheologically distinct cratonic lithosphere with enhanced viscosity within the chemical boundary layer and neglected compositional buoyancy for this proof-of-concept exercise; however, even the simplest of simulations demonstrate the need to further explore the consequences of lateral heterogeneity within the cratonic lithosphere.
CASE STUDIES AND PROMISING FUTURE WORK
We end with examples of two case studies, one from the North China craton (NCC) and one from the Yilgarn craton of Western Australia. The NCC has been a focus of both seismic imaging, structural, and geochemical studies and has been particularly extensively studied with dedicated, densely spaced seismic arrays, which have allowed beautiful images to be obtained of the lithospheric structure (e.g., Feng et al. 2022). It is a classic example of cratonic reactivation and destruction.
Download high-resolution image
The surface wave model of Feng et al. (2022), based on teleseismic Rayleigh waves and ambient noise cross-correlations, is shown in Figure 3A. The profile taken WNW to ESE from the central part of the craton across to its eastern edge and into the North China Basin illustrates both lateral and horizontal complexity inferred from the velocity structure. The authors of this work identify complex lateral variations in lithospheric thickness and fine-scale structure and variations in seismicity, in both the north–south and east–west directions (Feng et al. 2022).
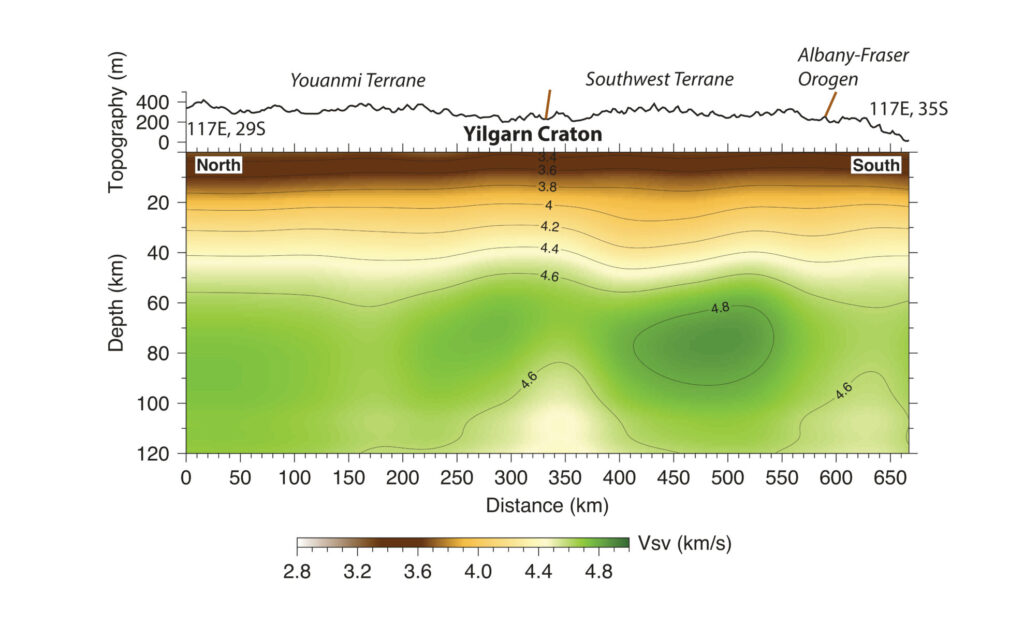
In comparison to the modified, deformed cratonic lithosphere inferred from the NCC, new results from the more tectonically stable Yilgarn craton of Western Australia similarly show significant complexity, as inferred from surface wave tomography. Figure 3B shows a profile through a new teleseismic Rayleigh wave-based model (Miller et al. 2023a) from a new seismic array in southwestern Western Australia that images the Yilgarn craton (Miller et al. 2023b). The structure of the Yilgarn craton is the product of a sequence of tectonic events, including Mesoarchean crustal formation and Neoarchean cratonization followed by later episodes of rifting (see Miller et al. 2023b). The net result of these events is complex with laterally varying structures that seem to have expressions extending through the entire cratonic lithosphere, which itself is significantly seismically faster and thicker than the NCC (Fig. 3B). These two test cases demonstrate, much like the simulations, the wide range of lateral variations within cratonic lithosphere, either spanning a long history of events leading to and being the result of large-scale deformation (NCC and fourth panel in Fig. 2) or representing localized events that seemingly do not disturb cratonic stability, but are still captured within the rock record (Yilgarn craton and second and third panels in Fig. 2).
In conclusion, the cratonic lithosphere continues to provide opportunities (literally and figuratively) to test constraints on early Earth processes and lithospheric strength, inspire new insight into the perhaps imperfect concepts of stability and longevity, and build multidisciplinary time–space collaborations that couple observations capturing multiple time periods with locations run through geodynamic models that test for physical feasibility. Indeed, if we hope to unlock the secrets trapped in the deep rock record, then we need to work collaboratively, within and across disciplines, and constructively as a community to embrace the complexity within the cratonic lithosphere.
ACKNOWLEDGMENTS
Thank you to Jens Hegg and Ping Zhang for assisting with figure drafting. The graduate work of Shannon Conner and Alexus Richardson provided preliminary insight and inspiration into the numerical models used in this review. We also thank the reviewers and editors for their constructive feedback.
REFERENCES
Afonso JC, Schutt DL (2012) The effects of polybaric partial melting on density and seismic velocities of mantle restites. Lithos 134: 289-303, doi: 10.1016/j.lithos.2012.01.009
Bedle H, Cooper CM, Frost CD (2021) Nature versus nurture: preservation and destruction of Archean cratons. Tectonics 40: e2021TC006714, doi: 10.1029/2021TC006714
Boyd FR (1989) Compositional distinction between oceanic and cratonic lithosphere. Earth and Planetary Science Letters 96: 15-26, doi: 10.1016/0012-821X(89)90120-9
Chin EJ and 6 coauthors (2021) The peridotite deformation cycle in cratons and the deep impact of subduction. Tectonophysics 817: 229029, doi: 10.1016/0012-821X(89)90120-9
Cooper CM, Lenardic A, Moresi L (2004) The thermal structure of stable continental lithosphere within a dynamic mantle. Earth and Planetary Science Letters 222: 807-817, doi: 10.1016/j.epsl.2004.04.008
Cooper CM, Miller MS (2014) Craton formation: internal structure inherited from closing of the early oceans. Lithosphere 6: 35-42, doi: 10.1130/L321.1
Cooper CM, Farrington RJ, Miller MS (2021) On the destructive tendencies of cratons. Geology 49: 195-200, doi: 10.1130/G48111.1
Currie CA, van Wijk J (2016) How craton margins are preserved: insights from geodynamic models. Journal of Geodynamics 100: 144-58, doi: 10.1016/j.jog.2016.03.015
Dalton CA, Bao X, Ma Z (2017) The thermal structure of cratonic lithosphere from global Rayleigh wave attenuation. Earth and Planetary Science Letters 457: 250-262, doi: 10.1016/j.epsl.2016.10.014
Evans RL and 10 coauthors (2011) Electrical lithosphere beneath the Kaapvaal craton, southern Africa. Journal of Geophysical Research: Solid Earth 116: B04105, doi: 10.1029/2010JB007883
Feng JK, Yao HJ, Chen L, Li CL (2022) Ongoing lithospheric alteration of the North China craton revealed by surface-wave tomography and geodetic observations. Geophysical Research Letters 49: e2022GL099403, doi: 10.1029/2022GL099403
Fischer KM and 5 coauthors (2020) A comparison of oceanic and continental mantle lithosphere. Physics of the Earth and Planetary Interiors 309: 106600, doi: 10.1016/j.pepi.2020.106600
Fu H-Y, Li Z-H, Chen L (2022) Continental mid‐lithosphere discontinuity: a water collector during craton evolution. Geophysical Research Letters 39: e2022GL101569, doi: 10.1029/2022GL101569
Jordan TH (1978) Composition and development of the continental tectosphere. Nature 274: 544-548, doi: 10.1038/274544a0
King SD, Anderson DL (1998) Edge-driven convection. Earth and Planetary Science Letters 160: 289-296, doi: 10.1016/S0012-821X(98)00089-2
Kusky T, Windley BF, Zhai M-G (2007) Tectonic evolution of the North China Block: from orogen to craton to orogen. Geological Society, London, Special Publications 280: 1-34, doi: 10.1144/SP280.1
Lee C-TA, Luffi P, Chin EJ (2011) Building and destroying continental mantle. Annual Review of Earth and Planetary Sciences 39: 59-90, doi: 10.1146/annurev-earth-040610-133505
Lenardic A, Moresi L, Mühlhaus H (2000) The role of mobile belts for the longevity of deep cratonic lithosphere: the crumple zone model. Geophysical Research Letters 27: 1235-1238, doi: 10.1029/1999GL008410
Liu L, Morgan JP, Xu Y, Menzies M (2018) Craton destruction 1: cratonic keel delamination along a weak midlithospheric discontinuity layer. Journal of Geophysical Research: Solid Earth 123: 10040-10068, doi: 10.1029/2017JB015374
Mansour J and 8 coauthors (2020) Underworld2: Python geodynamics modelling for desktop, HPC and cloud. Journal of Open Source Software 5: 1797, doi: 10.21105/joss.01797